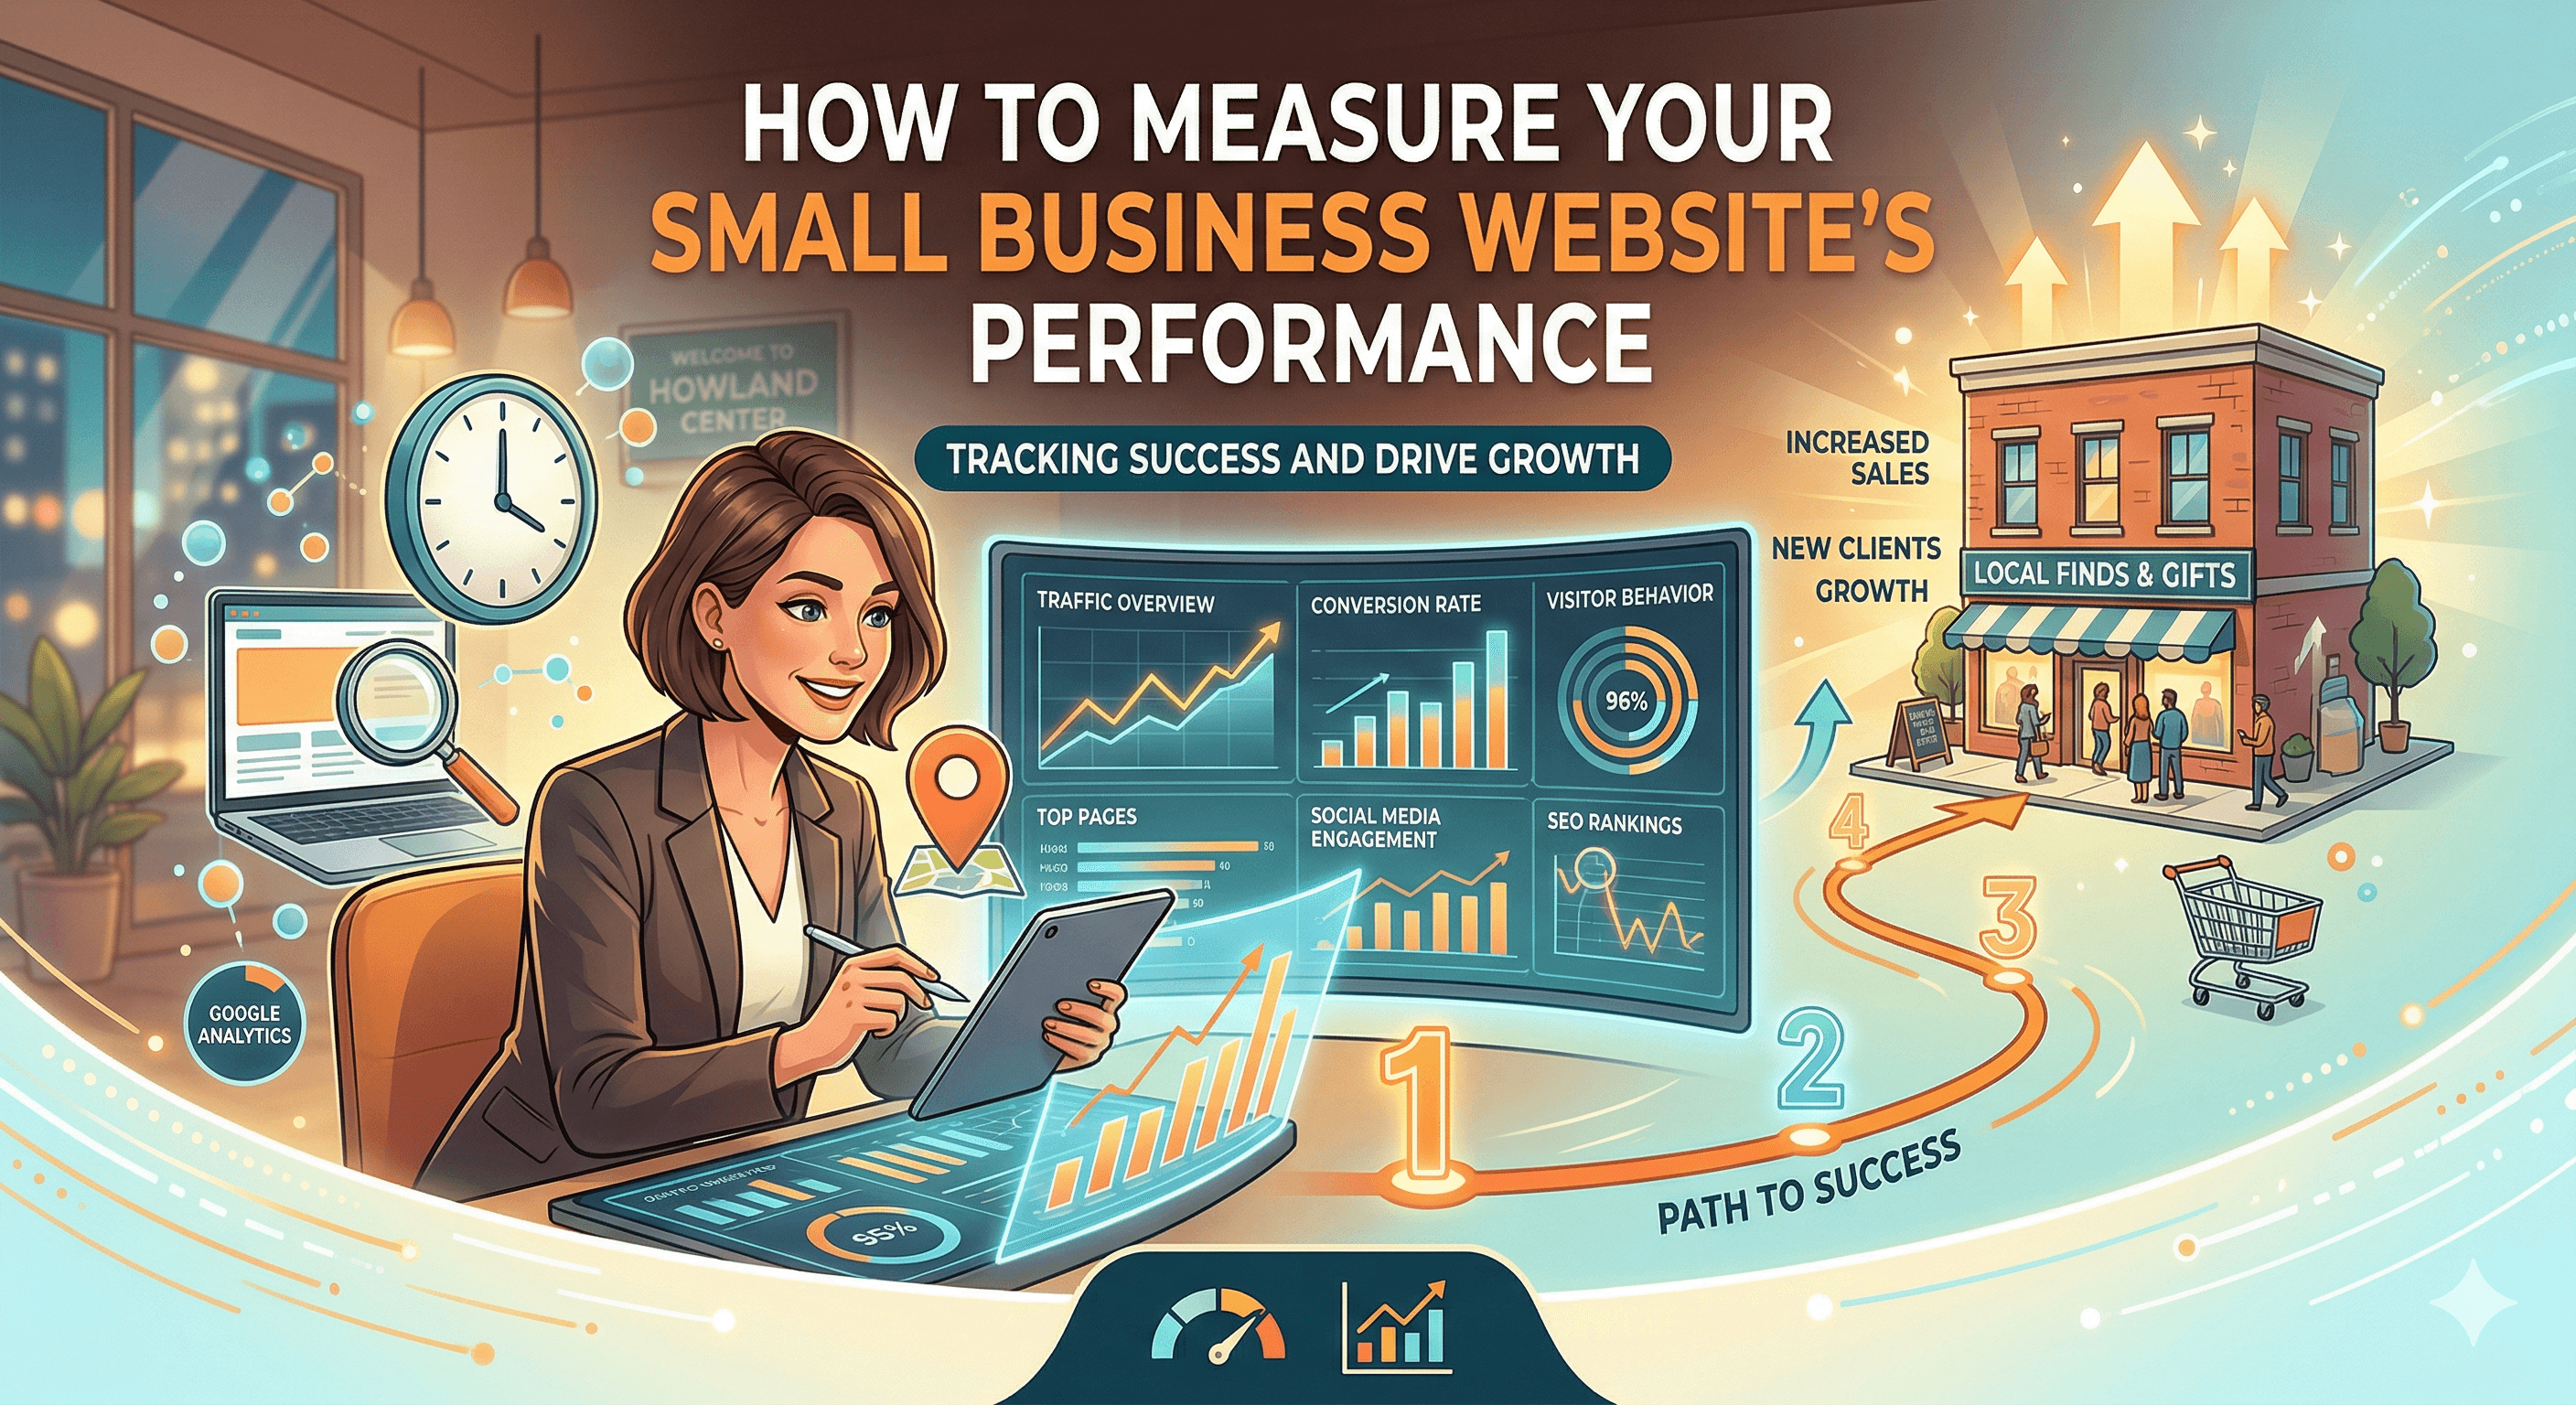
How to Measure Your Small Business Website's Performance
Your website is a business tool, and like any tool, you need to know whether it is working. Most small business owners either ignore their website analytics entirely or get lost in a sea of numbers without knowing which ones matter. This guide cuts through the noise and shows you exactly what to measure, how to measure it, and what to do with the data.
Metrics That Matter vs. Vanity Metrics
Not all numbers are created equal. Vanity metrics look impressive but do not tell you anything useful about your business. Meaningful metrics connect directly to your goals: leads, sales, and revenue.
Vanity metrics include total page views (without context), social media follower counts, raw visitor numbers, and time on site as a standalone number. These can look great in a report, but they do not tell you whether your website is actually generating business.
Meaningful metrics include conversion rate (what percentage of visitors take the action you want), cost per lead (if you are running paid ads), revenue per visitor, bounce rate on key landing pages, and organic search traffic for target keywords. These numbers tell you whether your website is doing its job.
The distinction matters because it changes how you spend your time and money. If you are chasing page views, you might create clickbait content that attracts visitors who never buy. If you are tracking conversion rates, you will focus on making every visit count.
Setting Up Your Tracking Foundation
Before you can measure anything, you need the right tools in place. For most small businesses, three free tools provide everything you need.
Google Analytics 4 (GA4) is your primary analytics platform. It tracks who visits your site, where they come from, what they do, and whether they convert. If you have not set up GA4 yet, our step-by-step guide on how to set up Google Analytics for your small business walks you through the entire process. Do this first, because you cannot analyze data you have not collected.
Google Search Console tracks your site's presence in Google search results. It shows you which keywords you rank for, how often your pages appear in search results, how often people click through to your site, and any technical issues Google finds when crawling your pages. It is completely free and essential for understanding your SEO performance.
Google PageSpeed Insights (pagespeed.web.dev) measures your site's loading speed and user experience. It provides both lab data (simulated tests) and field data (real user measurements) along with specific recommendations for improvement.
Install GA4 and Search Console as early as possible. They only start collecting data from the day you set them up, so the sooner you install them, the sooner you have useful data to analyze.
Traffic Metrics: Understanding Your Visitors
Traffic metrics tell you how many people visit your site and where they come from. The key traffic metrics to track include the following.
Sessions represent individual visits to your site. One person visiting your site three times in a month counts as three sessions. This is a more useful number than page views because it reflects actual visits rather than how many pages were loaded.
Users represent unique visitors. This tells you how many distinct people visited your site. Compare users to sessions to understand how often people return. If you have 1,000 sessions from 900 users, most visitors are coming once. If you have 1,000 sessions from 500 users, people are coming back, which is usually a good sign.
Traffic sources tell you where your visitors come from. GA4 breaks this into channels: organic search (people who found you through Google), direct (people who typed your URL), referral (people who clicked a link from another site), social (people who came from social media), and paid (people who clicked an ad). For most small businesses, organic search should be your largest and most valuable traffic source over time.
New vs. returning visitors shows the balance between attracting new prospects and retaining existing ones. A healthy site has a mix of both. If you see almost no returning visitors, your site may not be giving people a reason to come back.
Behavior Metrics: What Visitors Do on Your Site
Traffic numbers tell you who shows up. Behavior metrics tell you what they do once they arrive.
Bounce rate measures the percentage of visitors who leave your site after viewing only one page. A high bounce rate on your homepage or landing pages usually signals a problem: the page is not meeting visitor expectations, the content is not compelling, or the next step is not clear. However, a high bounce rate on a blog post can be normal if the visitor found the answer they needed.
Pages per session tells you how many pages the average visitor views. More pages usually indicates engagement, especially if visitors are navigating from your blog to your services page to your contact page. This metric is most useful when combined with conversion data.
Average engagement time (GA4's replacement for average session duration) measures how long visitors actively interact with your site. This is more accurate than the old session duration metric because it only counts time when the page is in the foreground and the user is active.
Top exit pages show you where visitors most commonly leave your site. If your contact page has a high exit rate, that might be fine (they submitted the form and left). If your services page has a high exit rate, visitors might not be finding what they need.
Conversion Metrics: The Numbers That Pay the Bills
Conversions are the actions you want visitors to take. For small businesses, common conversions include form submissions (contact forms, quote requests), phone calls, email signups, purchases, appointment bookings, and file downloads.
In GA4, you set up conversions by defining "key events" (formerly called conversions). At minimum, track form submissions on your contact page and any other pages with forms. If your phone number is clickable (and it should be on mobile), track phone call clicks as well.
Your conversion rate is the percentage of visitors who complete a desired action. For small business websites, a conversion rate of 2% to 5% for a contact form is typical. E-commerce sites average 1% to 3%. If your rates are below these benchmarks, your site likely has a problem with its messaging, design, or user experience. Our guide on how to write website copy that converts covers the copywriting side of improving conversions.
Cost per conversion matters if you are running paid advertising. Divide your total ad spend by the number of conversions to find your cost per lead. Then compare that to the average lifetime value of a customer to determine whether your advertising is profitable.
Speed and Technical Performance
Site speed affects both user experience and search rankings. Google has been explicit that page load time is a ranking factor, and real-world data consistently shows that slower sites have lower conversion rates.
Core Web Vitals are Google's three key metrics for user experience. Largest Contentful Paint (LCP) measures how quickly the main content of a page loads. The target is under 2.5 seconds. Interaction to Next Paint (INP) measures how quickly your site responds when a user interacts with it (clicks a button, selects a menu item). The target is under 200 milliseconds. Cumulative Layout Shift (CLS) measures visual stability: how much the page layout shifts around as it loads. The target is under 0.1.
Check your Core Web Vitals monthly using Google PageSpeed Insights or the Core Web Vitals report in Google Search Console. If any metric fails, the tool will tell you exactly what to fix. Common issues include unoptimized images, render-blocking JavaScript, missing image dimensions, and slow server response times.
Site speed has a direct impact on your bottom line. Even small improvements in load time can measurably increase conversions and reduce bounce rates. For a detailed look at the financial impact, read our article on how slow websites cost small businesses millions.
SEO Performance Metrics
If you want free, sustainable traffic from Google, you need to track your SEO performance. Our comprehensive SEO guide for small businesses covers the full strategy, but here are the key metrics to monitor.
Organic search traffic is the number of visitors who find your site through unpaid search results. In GA4, filter your traffic by the "Organic Search" channel. This number should trend upward over time if your SEO is working.
Keyword rankings show where your pages appear in search results for specific terms. Google Search Console shows you average position for each keyword. Focus on the keywords that matter most to your business, not every keyword your site happens to rank for. A page ranking #8 for "plumber in Denver" is worth more attention than a page ranking #1 for an obscure phrase nobody searches for.
Click-through rate (CTR) from search results tells you how often people click on your listing when it appears. If you rank well but have a low CTR, your page title and meta description may need improvement. Average CTR varies by position: the #1 result gets roughly 30% of clicks, #2 gets about 15%, and it drops off from there.
Indexed pages show how many of your pages Google has found and included in its search index. Check this in Search Console under the "Pages" report. If important pages are not indexed, investigate why. Common reasons include noindex tags, crawl errors, or thin content.
Building Your Monthly Reporting Routine
Data is only useful if you act on it. Create a simple monthly reporting routine that takes 30 to 60 minutes and keeps you focused on what matters.
At the beginning of each month, pull the previous month's numbers for total sessions and users, traffic by channel (organic, direct, referral, social, paid), top ten pages by traffic, conversion count and conversion rate, average page load time, and any new SEO keyword rankings or changes.
Compare each number to the previous month and to the same month last year (once you have enough data). Look for trends, not single data points. A 10% drop in traffic for one month might be seasonal. Three consecutive months of decline is a pattern that needs investigation.
Create a simple spreadsheet or use a tool like Google Looker Studio (free) to automate your monthly report. The easier it is to generate, the more likely you are to do it consistently. Focus on three to five key metrics that align with your business goals, and do not waste time on numbers that do not connect to revenue.
The small business owners who consistently outperform their competitors online are not the ones with the biggest budgets or the fanciest websites. They are the ones who track their performance, identify what is working, and do more of it. Start measuring today, and you will have the data you need to make your website a true growth engine for your business.